Difference: ASmallMeteorologicalStation (3 vs. 4)
Revision 42017-10-11 - uli
| Line: 1 to 1 | ||||||||
|---|---|---|---|---|---|---|---|---|
A meteorological station. | ||||||||
| Line: 14 to 14 | ||||||||
|
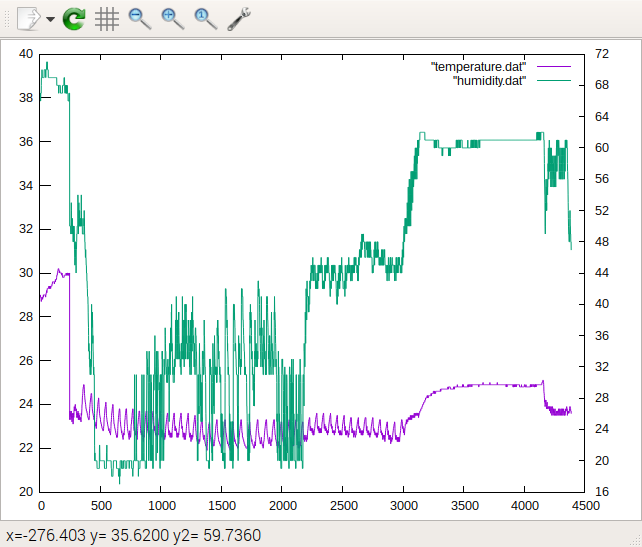
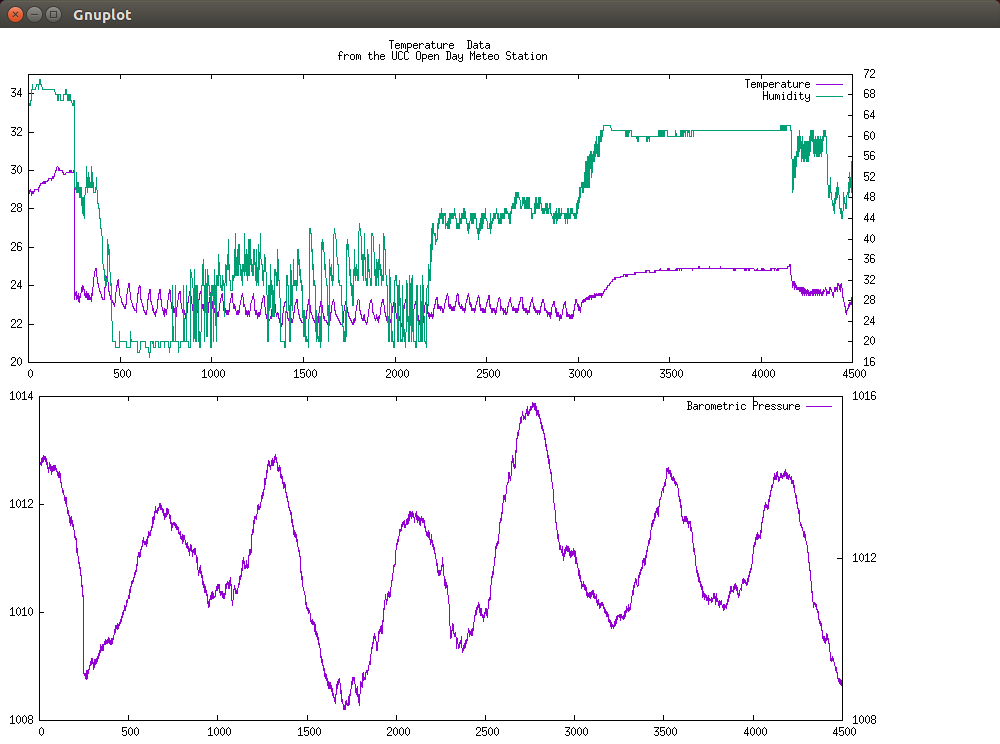
The following plot shows the temperature and the humidity measured in the computer lab over a few days. One can clearly see that at the beginning of the measurement period the air conditioner had broken down and the temperature rose up to 30 °C while the humidity rose to 70%. The temperature drop which happened when the air conditioner was repaired is clearly visible. | ||||||||
| Changed: | ||||||||
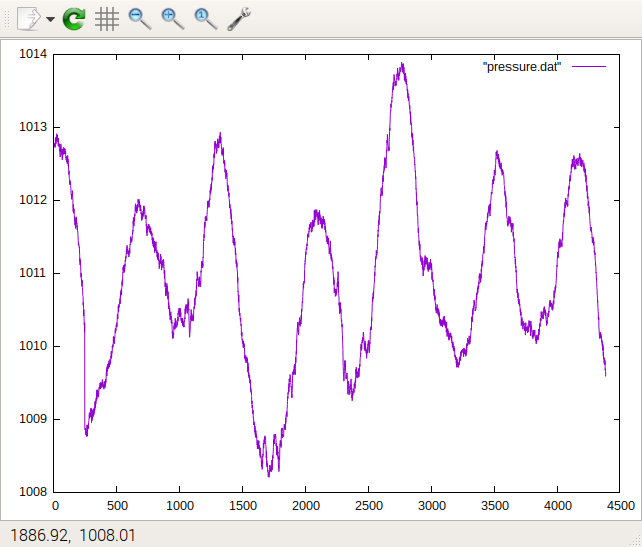
| < < |  ... and the barometric pressure.
 | |||||||
| > > |  | |||||||
|
-- | ||||||||
| Line: 26 to 22 | ||||||||
| Changed: | ||||||||
| < < |
| |||||||
| > > |
| |||||||
| ||||||||
| Added: | ||||||||
| > > |
| |||||||
View topic | History: r5 < r4 < r3 < r2 | More topic actions...
Ideas, requests, problems regarding TWiki? Send feedback