Difference: BShinyeiNopPPD42NS (1 vs. 4)
Revision 42022-06-04 - UliRaich
| Line: 1 to 1 | ||||||||
|---|---|---|---|---|---|---|---|---|
The Shinyei PPD42NS sensor | ||||||||
| Line: 24 to 25 | ||||||||
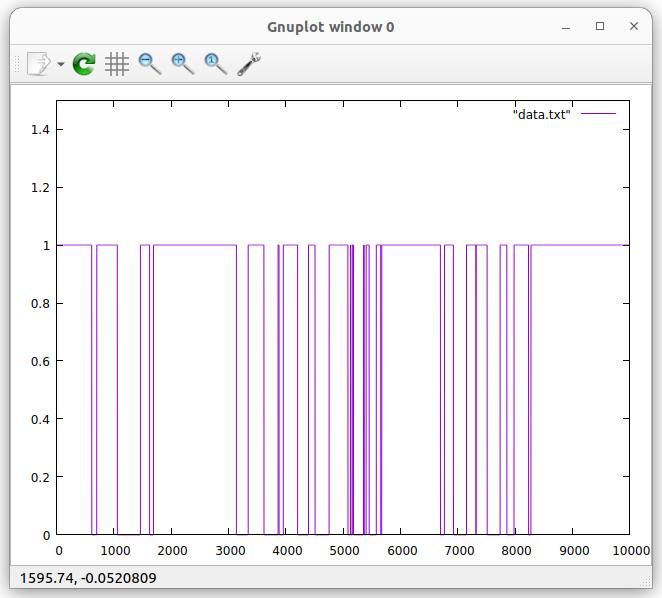
| The plot shows a measurement where a match has been lighted and the smoke blown into the sensor. The particle concentration can be measured by calculating the relative time the signal is low with respect to the measurement period (low occupancy time). | ||||||||
| Added: | ||||||||
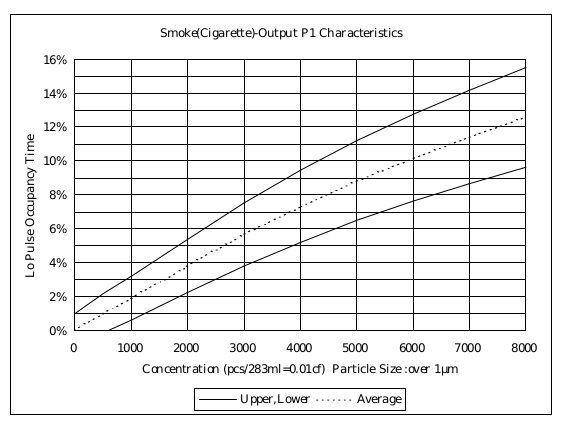
| > > | Shinyei publishes a calibration curve in the data sheet showing the relation between the low occupancy time and the number of particles in 283 ml.

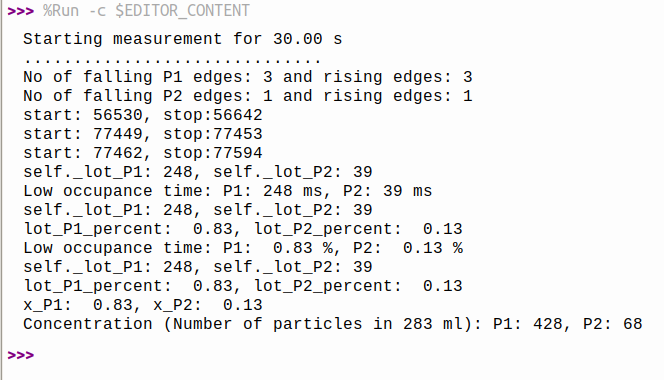
The driverThe shinyei.py driver is implemented as a MicroPython module. It has the following methods:
 | |||||||
-- Comments | ||||||||
| Line: 31 to 53 | ||||||||
| ||||||||
| Added: | ||||||||
| > > |
| |||||||
Revision 32022-06-04 - UliRaich
| Line: 1 to 1 | ||||||||
|---|---|---|---|---|---|---|---|---|
The Shinyei PPD42NS sensor | ||||||||
| Line: 16 to 16 | ||||||||
| To get a feeling about the signals emitted by the Shinyei PPD42NS we first write a very simple program (pulses.py) that reads the P1 data line every 1 ms and saves the result in an array. It does so during 10 s. After data taking, the results are printed on the serial line. We can run the program with | ||||||||
| Deleted: | ||||||||
| < < | ||||||||
ampy run pulses.py > data.txtand thus redirect the results into a file that can be plotted with gnuplot.  | ||||||||
| Changed: | ||||||||
| < < | The plot shows a measurement where a match has been lighted and the smoke blown into the sensor. The particle concentration can be measured by calculating the relative time the signal is low with respect to the measurement period. | |||||||
| > > | The plot shows a measurement where a match has been lighted and the smoke blown into the sensor. The particle concentration can be measured by calculating the relative time the signal is low with respect to the measurement period (low occupancy time). | |||||||
|
-- | ||||||||
Revision 22022-06-03 - UliRaich
| Line: 1 to 1 | |||||||||||||
|---|---|---|---|---|---|---|---|---|---|---|---|---|---|
| |||||||||||||
| Changed: | |||||||||||||
| < < | The Shinyei PPD42NS sensor | ||||||||||||
| > > | The Shinyei PPD42NS sensor | ||||||||||||
| This sensor emits a low occupancy time signal where the relative time the signal is in low state is measured. | |||||||||||||
| Line: 11 to 11 | |||||||||||||
| |||||||||||||
| Added: | |||||||||||||
| > > | Reading the signalTo get a feeling about the signals emitted by the Shinyei PPD42NS we first write a very simple program (pulses.py) that reads the P1 data line every 1 ms and saves the result in an array. It does so during 10 s. After data taking, the results are printed on the serial line. We can run the program withampy run pulses.py > data.txtand thus redirect the results into a file that can be plotted with gnuplot.  The plot shows a measurement where a match has been lighted and the smoke blown into the sensor. The particle concentration can be measured by calculating the relative time the signal is low with respect to the measurement period.
 | ||||||||||||
-- Comments | |||||||||||||
| Added: | |||||||||||||
| > > |
| ||||||||||||
Revision 12022-06-01 - UliRaich
| Line: 1 to 1 | |||||||||||||||||||||||||||
|---|---|---|---|---|---|---|---|---|---|---|---|---|---|---|---|---|---|---|---|---|---|---|---|---|---|---|---|
| Added: | |||||||||||||||||||||||||||
| > > |
The Shinyei PPD42NS sensorThis sensor emits a low occupancy time signal where the relative time the signal is in low state is measured. The connections as are follows:
Comments | ||||||||||||||||||||||||||
View topic | History: r4 < r3 < r2 < r1 | More topic actions...
Ideas, requests, problems regarding TWiki? Send feedback