

| I | Attachment | History | Action | Size | Date | Who | Comment |
|---|---|---|---|---|---|---|---|
| |
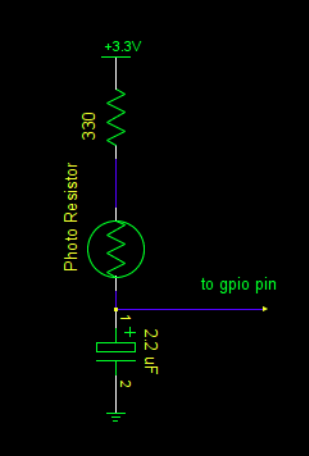
photoResistorCircuit.png | r1 | manage | 14.3 K | 2017-04-06 - 11:06 | UnknownUser |
This topic: Embedded_Systems > WebHome > CourseExercises > LightMeasurement
Topic revision: r1 - 2017-04-06 - uli
Ideas, requests, problems regarding TWiki? Send feedback