Exercise 10: A TFT Display and the ST7735 display controller
Introduction
The ST7735 is described in
TFT Display on this TWiki. It comes with a big bunch of demo programs showing the functionality of the driver. Please inspect the source code of each of these demos and run them. This should give you a good feeling of the possibilities the driver offers.
Exercise 1: Random lines, rectangles and circles
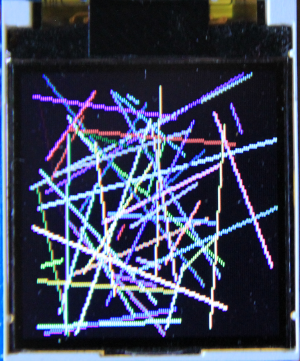
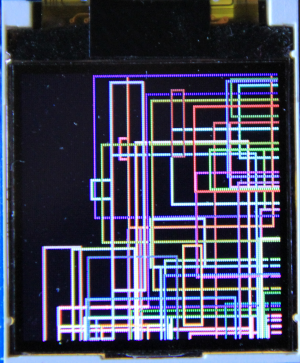
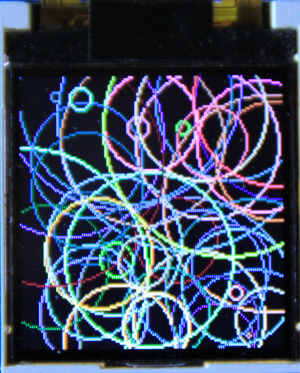
Write a MicroPython script that draws 50
- random lines
- random rectangles
- random circles
in random colors. These are 3 distinct tests. Draw the lines first, show them for 5s, clear the display and start showing the rectangles ...
Write the above script once using direct drawing primitives (
draw_line(...), draw_rectangle(...), draw_circle(...)) and then modify your code to use the primitives (
line(...),rect(...),circle(...)) passing through the frame buffer. Where do you have to place the
show() calls to get a similar result?
Exercise 2: Text drawing
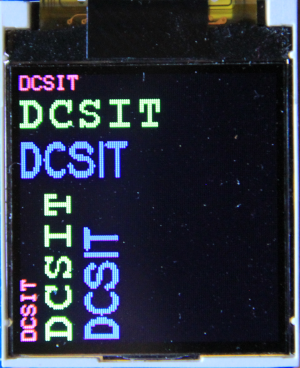
Write a script that prints "DSCIT" in three different fonts (sysfont, courier20 and EspressoDolce18x24) in the colors red, green and blue. Draw the text once in portrait and once in landscape mode
The font files are actually executable Python code that you can run on CPython on your laptop. Try to run e.g. courier20.py and sysfont.py. You will see a letter, which in case of the courier font will be upright(hmap() returns true), while in the sysfont case it will be turned clockwise by 90 ° (hmap() returns false). Can you write a piece of code that will transform the sysfont glyph into an upright layout?
Exercise 3: Graphical User Interface (GUI) elements from nanogui
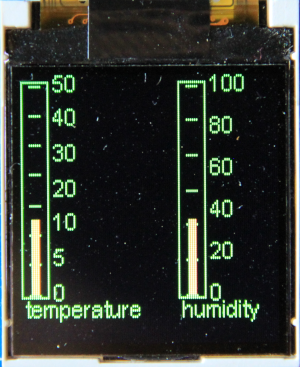
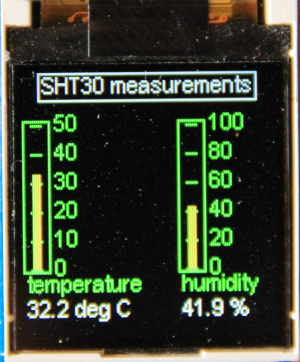
Create 2 meters, one for temperature (0..50) and one for humidity (0..100). Generate dummy temperature and humidity values and display them in the meters.
Once the graphics works replace the dummy measurements by real ones from the SHT30.
Exercise 4: Plots
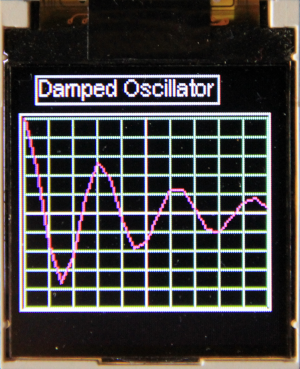
Create a plot of a damped oscillator
Exercise 5: A new GUI element (bonus point)
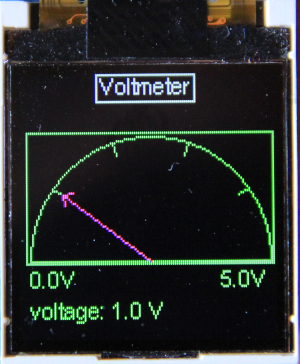
Create a voltmeter application to measure voltages. You will need a new
Scale GUI element similar to the nanogui Dial, but designed by yourself, which displays the voltage read from an ADC. Values to be displayed must range from 0 to 5V. The photo below shows the voltmeter, reading a voltage of 1V.
Exercise 6: Super Mario, a bit of a challenge!
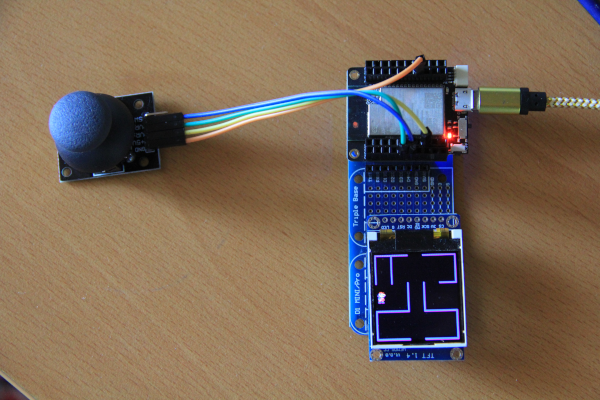
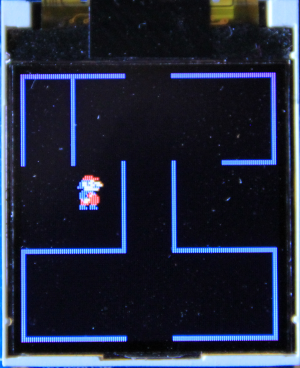
Two simple arcade games come with the SD1351 driver demos. One of them is a Super Mario game, which however is based on hardware we don't have. As far as I can see they use a joystick with BlueTooth connection. You can replace this with an analogue joystick we have in our sensor box. 2 ADC channels are needed to read it out.
Here are the connections:
| Joystick |
ESP32 CPU board |
| GND |
GND |
| 5V |
3.3V |
| VRx |
GPIO 33 or ADC 05 |
| VRy |
GPIO 34 or ADC 10 |
Attenuate the input signal by 11 dB. When reading out the ADC with the joystick in its rest position you will obtain values of around 1830. If the value gets lower than 1000 Mario runs left, for values > 2000 he runs right and for values 1000..2000 he is standing still. Same for up and down on the second ADC channel. The ADC channels are only accessible on the ESP32 CPU card, not on the WeMos D1 bus! have a look at the CPU card pinout shown on the TWiki page
The hardware.
This is how it will look like:
The exercise sheet in odt format:
https://afnog.iotworkshop.africa/pub/IoT_Course_English/ST7735TFTDisplay/exercise_10.odt
--
 Uli Raich - 2020-07-26
Comments
 The font files are actually executable Python code that you can run on CPython on your laptop. Try to run e.g. courier20.py and sysfont.py. You will see a letter, which in case of the courier font will be upright(hmap() returns true), while in the sysfont case it will be turned clockwise by 90 ° (hmap() returns false). Can you write a piece of code that will transform the sysfont glyph into an upright layout?
